Explore Our Insights

Top 5 Benefits to Centralized Data
With the enormous revenue potential tied to digitization, data management is becoming even more critical, reaching an all-time high in demand for enterprise data management initiatives.

5 Reasons Snowflake is The Best Financial Data Platform
Cloud-based technology like Snowflake provide financial services organizations with a much needed competitive advantage.

Snowflake Data Warehouse Advantages
Success with Snowflake will lead to building a data foundation that future initiatives can build on to further advance and grow the organization’s data and analytics capabilities.

Snowflake ETL vs. ELT
There are two main data movement processes for the Snowflake data warehouse technology platform. Extract, Transform, and Load (ETL) vs. Extract, Load, and Transform (ELT).

Snowflake Delivers a Single Data Experience Across Multiple Platforms
Snowflake’s core architecture is built on a multi-tier cloud data platform that scales independently. Snowflake’s multi-cluster shared data architecture consolidates data warehouses, data marts, and data lakes into a single source of truth that enables any data workload on any cloud with a simple, powerful, and flexible platform.

Self-Service Power BI with Shared Datasets
Leveraging the shared datasets feature from Power BI allows your company’s analysts to work from a single source of truth.

Sharing a Power BI report within Teams
Do your business users have trouble finding reports and navigating through the Power BI Service? If your organization uses Microsoft Teams, you can embed a report directly in a channel for greater visibility.

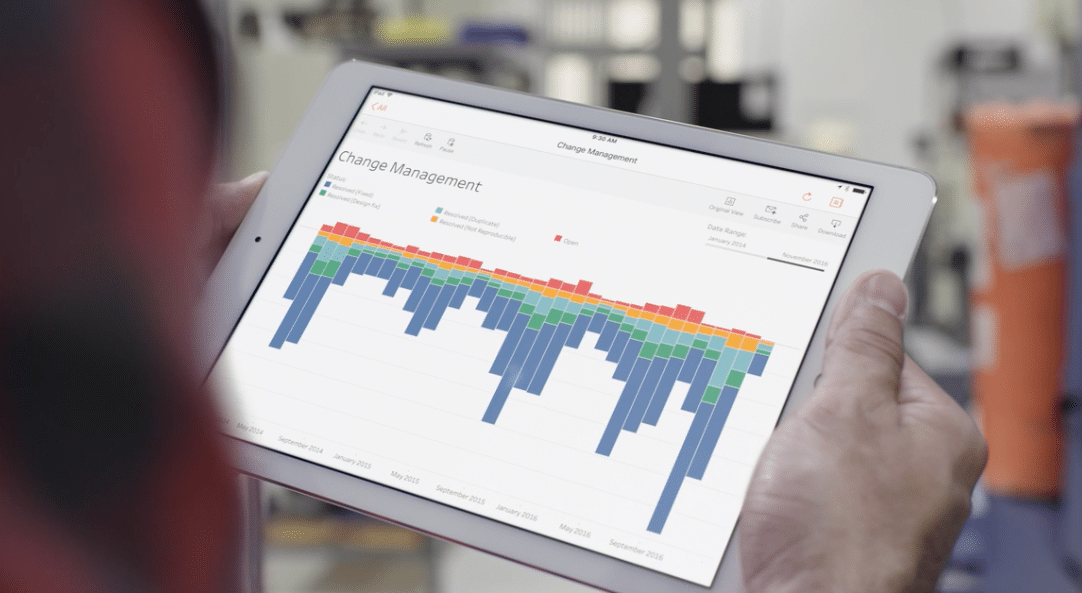
Overview: The Tableau Suite of Products
The Tableau Suite of products consists of several resources that are designed to enable users to integrate various data sources and create visualizations that can be shared enterprise wide and externally. Here’s an overview of each Tableau product.

Exporting DATA from Tableau to Excel
No matter how beautiful and informative and actionable your Tableau visualizations may be, there will always be a person or use case for exporting data to a tabular format usually via excel.

The Value of Data Integration
Integration streamlines the data lifecycle to enable a data-driven organization by moving the data closer to the point of action.

Six Reasons to Consider Power BI Premium
Capabilities to bring together self-service analytics and enterprise analytics solutions.
