Implementing Power BI Report Usage Metrics

Ever wonder how often your Power BI report is being viewed? Set up a Usage Metrics report to monitor who’s utilizing your report.

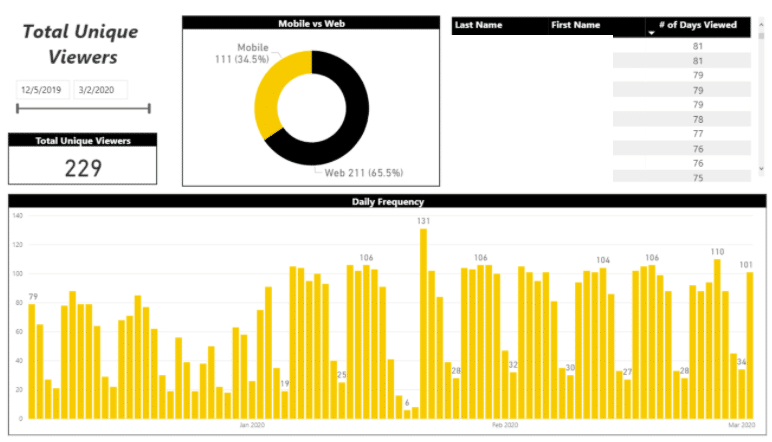
Power BI offers the ability to look at the usage statistics for any given report in the last 90 days. It’s always being calculated behind-the-scenes, but you need to intentionally set up a report. The screenshot above helps to answer the following questions:
- How many people are viewing the report?
- Which specific people are viewing it? (Usernames are masked in the table above)
- How frequently/consistently are they viewing?
- Which method (mobile or web) are the using?
Keeping tabs on usage helps to understand the effectiveness of your report. You may create a report that seems ideal for your end users, but if you find that it’s hardly ever being view, is it really an effective report? The adoption of report consumption is almost as important as the report content itself.
Without a usage report, your understanding of consumption would be limited to anecdotal information. You may ask an end user how often they view the report – if they respond with “pretty often”, you’d have no way to quantify what that means.
How to set up a Usage Report
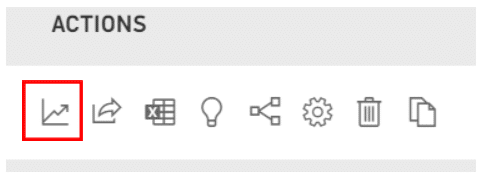
Navigate to the report list within your Power BI workspace. From the list of icons, select the Line Graph icon:

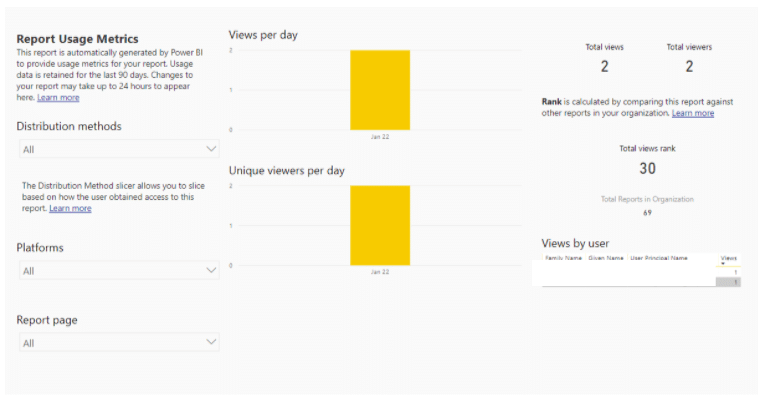
This will generate a sample dashboard utilizing the usage metrics that Power BI inherently collects:

For the time being, this will be a report that is “run” on demand any time that you press the metrics icon. The standard report that is generated is fine to use but is also fairly basic. However, you have the ability to take this underlying dataset and create your own report from it.
Build your own Usage Metrics report
From Power BI Desktop, open a blank file. From the Get Data section, select Power BI Dataset. This will bring up a list of available datasets within the Power BI Service that are available to you. Within this list, you will be able to find one called Report Usage Metrics Model (using the search bar is the easiest way to find it). Once you click Create, it will generate a dataset for you to begin building your report. Since it’s a live connection, your options for data modifications are somewhat limited, but you can add in any measures that you see fit to enhance this data.
Having usage reports will help you to keep a pulse on the demand for what’s been created. In addition, trending this usage can be a way to track the adoption for the particular report and Power BI overall.

